
Overview
Your Everflow
You can reach it two ways:
The best part? You can set it up exactly how you want without affecting your team's views.
Customizing Your Dashboard
Quick Setup
Smart Layout Tips
- Adjust size to keep important cards visible without scrolling
- Group related information together
- Keep up with pending requests to stay up to date
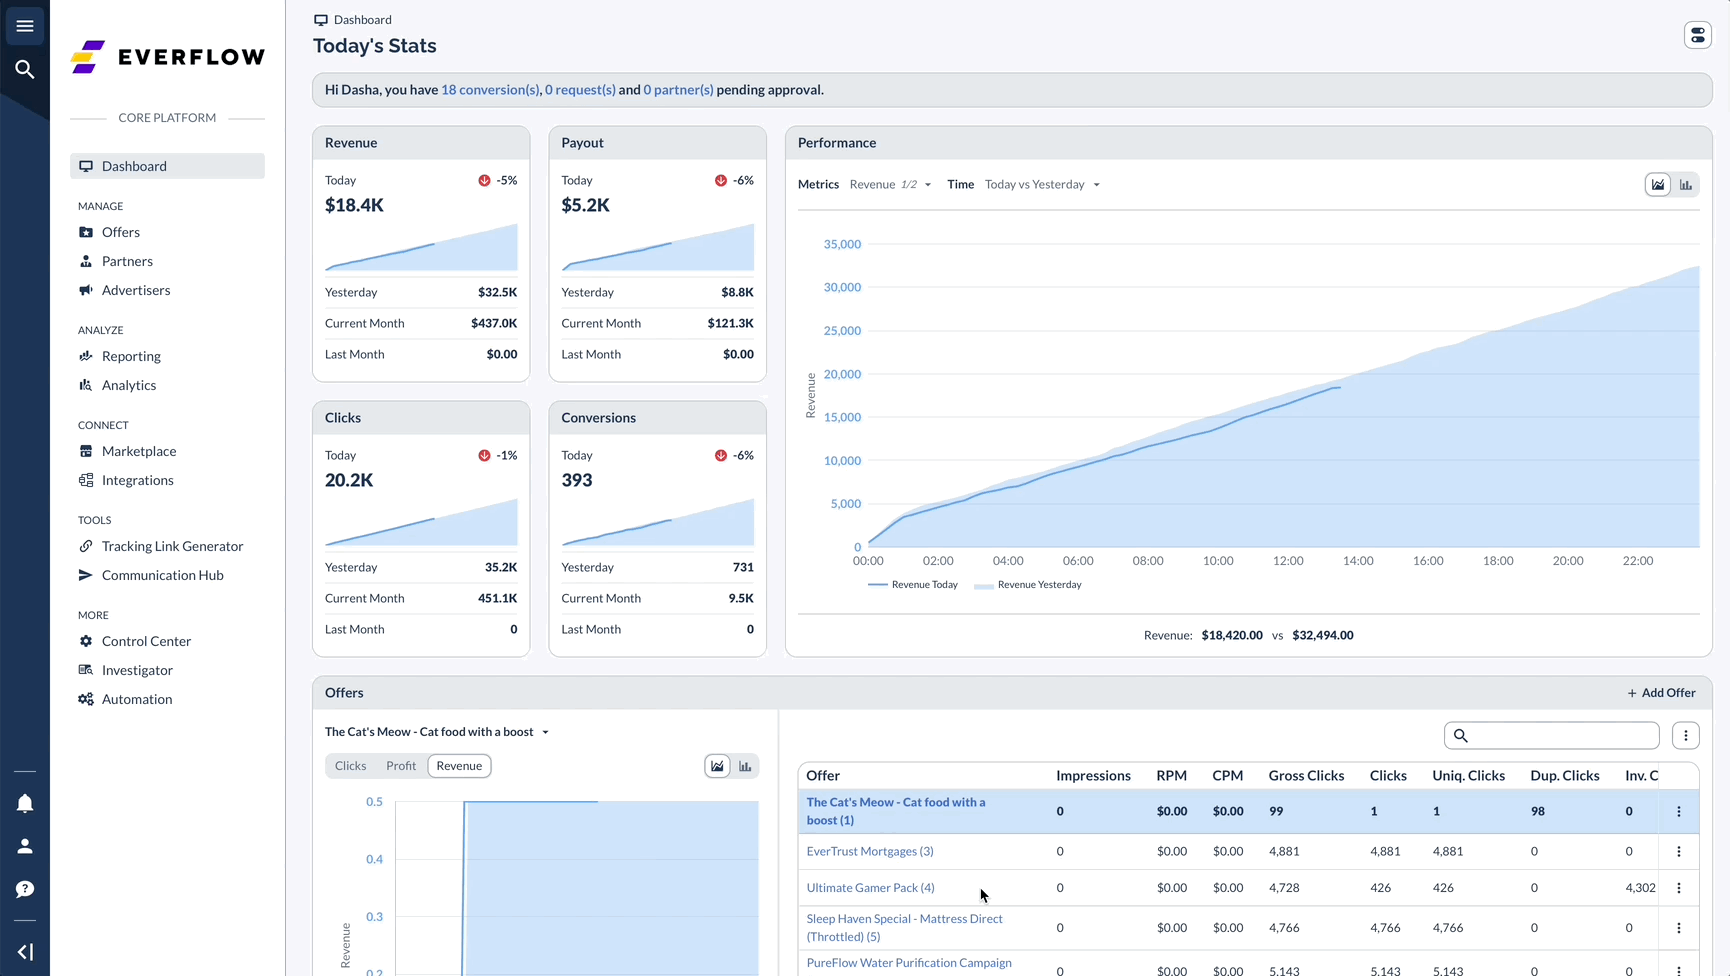
Overview Cards Features
Performance Graphs
- Compare Today vs. Yesterday stats
- Choose between Clicks, Profit, or Revenue metrics
- View 15-minute interval data on hover
- Use dropdown menus to select specific Offers, Partners, or Advertisers
Quick Actions
Pending Requests Banner
Monitor and act on:
- Pending Conversions
- Partner applications
- Offer requests
- Click any item to navigate directly to approval screens
Customization Examples
[Pending Requests Banner] (You can toggle it off)
[Revenue] [Payout] [Conversions]
[Partners Overview] [Active Offers]
[Performance Card] [Click Data]
[Marketplace Connections] - if you are a part of the Everflow Marketplace
Key metrics to display:
For example: If you are a Brand, you will not likely need stats on the Advertiser, since you are the Advertiser. That’s why having a highly customizable dashboard is important.
Core Financial Metrics:
Supporting Metrics (for financial analysis):
Metrics to Hide/Deprioritize:
Recommended Dashboard Layout:
[Revenue Card - Expanded]
[Profit & Margin Cards]
[Payout Tracking Card]
[Gross Sales Overview]
[EPC/RPM Analysis Cards]
[Conversion Value Card]
The finance team should also consider:


