Introduction
Traffic Health is Everflow's integrated domain health monitoring solution that gives you visibility into your tracking domains to minimize how blacklisting or downtime impacts your business. Every day, networks lose thousands in revenue because they don't know their domains are experiencing issues. The consequences are immediate: traffic gets blocked, conversion tracking fails, revenue drops without explanation, and partner relationships suffer.
Unlike standalone monitoring tools, Traffic Health connects powerful security services like Google Threat Intelligence directly to your Everflow Core Platform. This integration creates a unique advantage since you can see exactly how security tools view your domains alongside your performance metrics, giving you a complete picture of your traffic health.
Access Requirements
Traffic Health appears as a menu item under Tools for all users, regardless of their permission level. However, users without proper permissions will see a splash page when attempting to access the feature.
For Users Without Permissions
If you don't have the required permissions to access Traffic Health, you'll see a message stating: "You don't have required permissions to access this feature. Please contact your administrator to request access." Be sure to include the instructions below when reaching out to your administrator.
Enabling Traffic Health Access
To enable access to Traffic Health for specific roles, administrators should follow these steps:
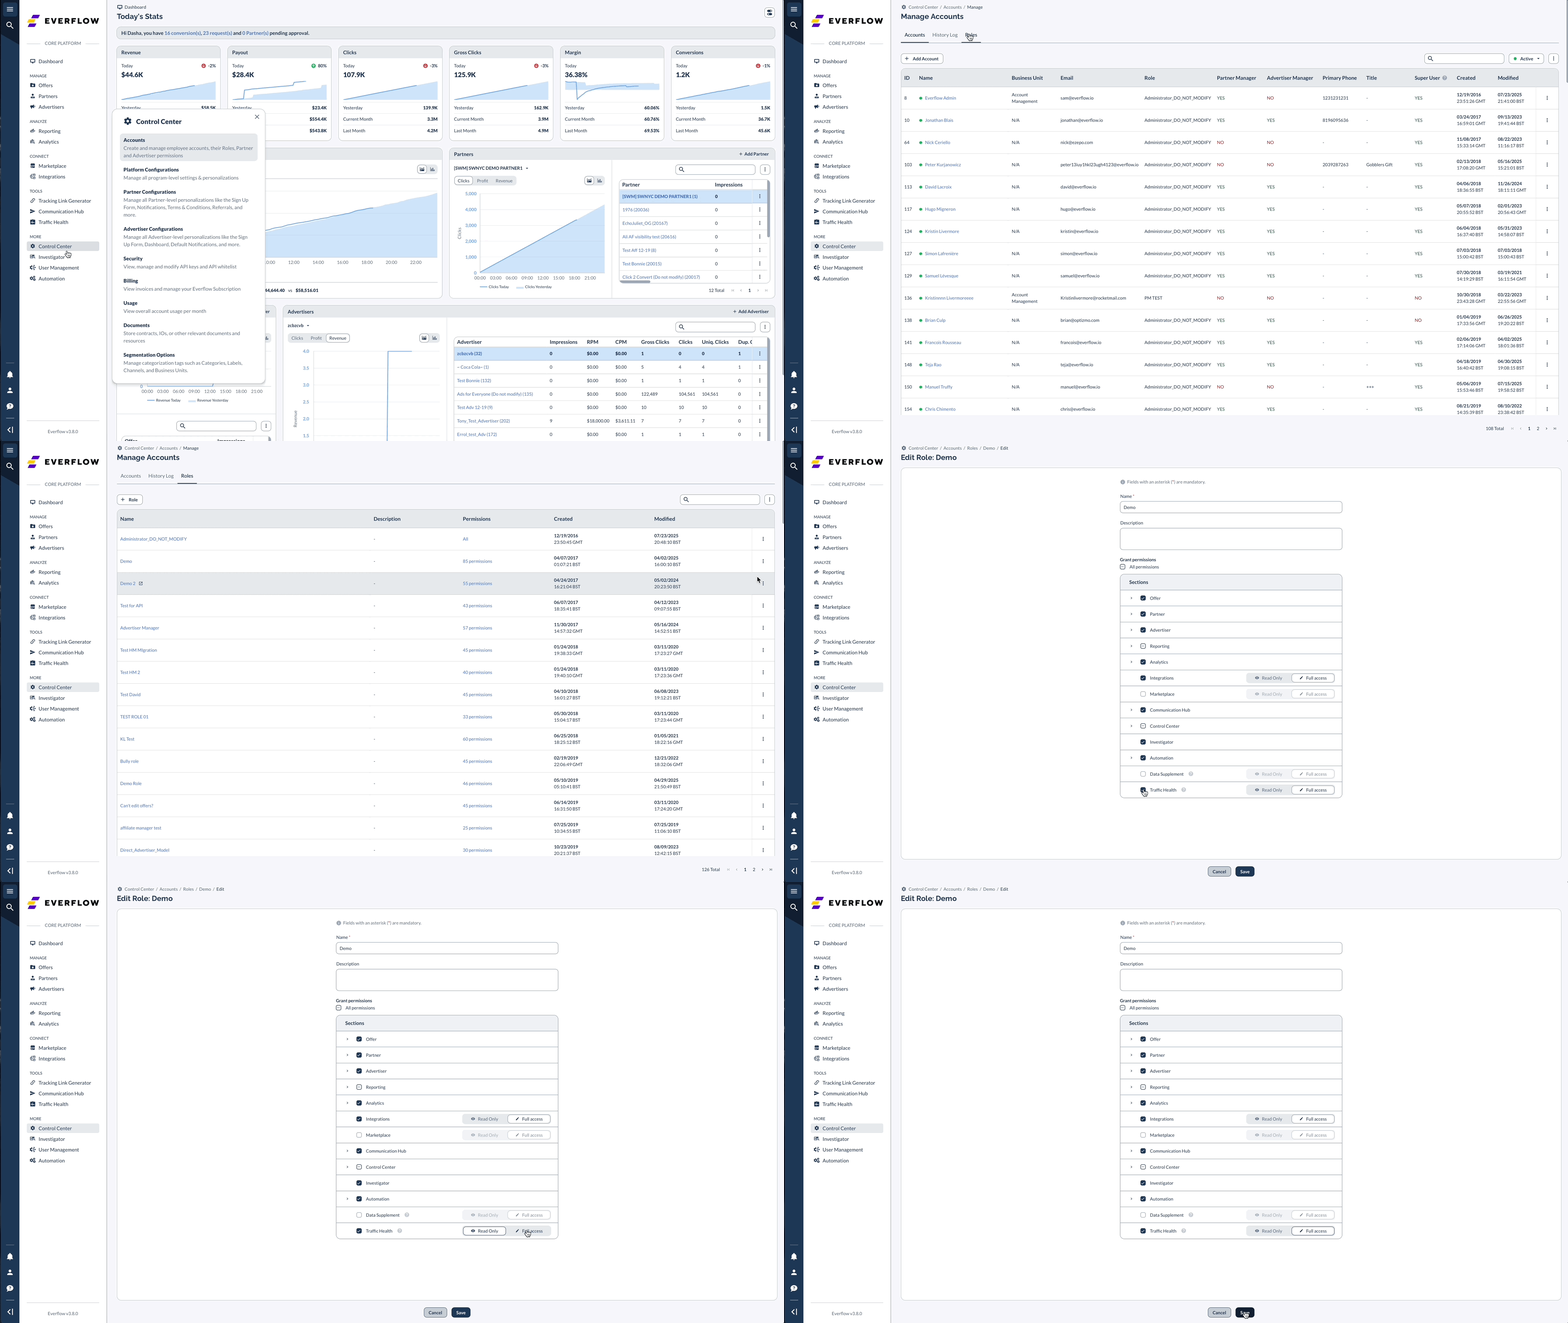
Traffic Health Subscription Tiers
To learn more about different Traffic Health subscription tiers and upgrade options:
The Overview Tab
The Overview tab serves as your go-to for domain health monitoring, providing a comprehensive view of all domain statuses and alerts.
Domain Status Summary
At the top of the dashboard, you'll find three key metrics that give you an immediate health assessment:
Domains Count
Shows the total number of domains under monitoring. This helps you quickly verify all your domains are being tracked.
Status Indicators
Displays how many domains are UP (functioning normally) versus DOWN (experiencing issues). The color-coded indicators make it easy to spot problems at a glance.
Reputation Metrics (Core and Premium plans)
This area shows how many domains are clean versus flagged by security providers. This helps you prioritize which domains need attention.
Domain Alert Banner
When Traffic Health detects an issue with one of your domains, a prominent alert banner appears containing:
- The affected domain name highlighted in red
- A brief description of the detected issue
- Information about potential traffic impact
- A direct link to view all related incidents
This alert system ensures you're immediately aware of any critical domain problems.
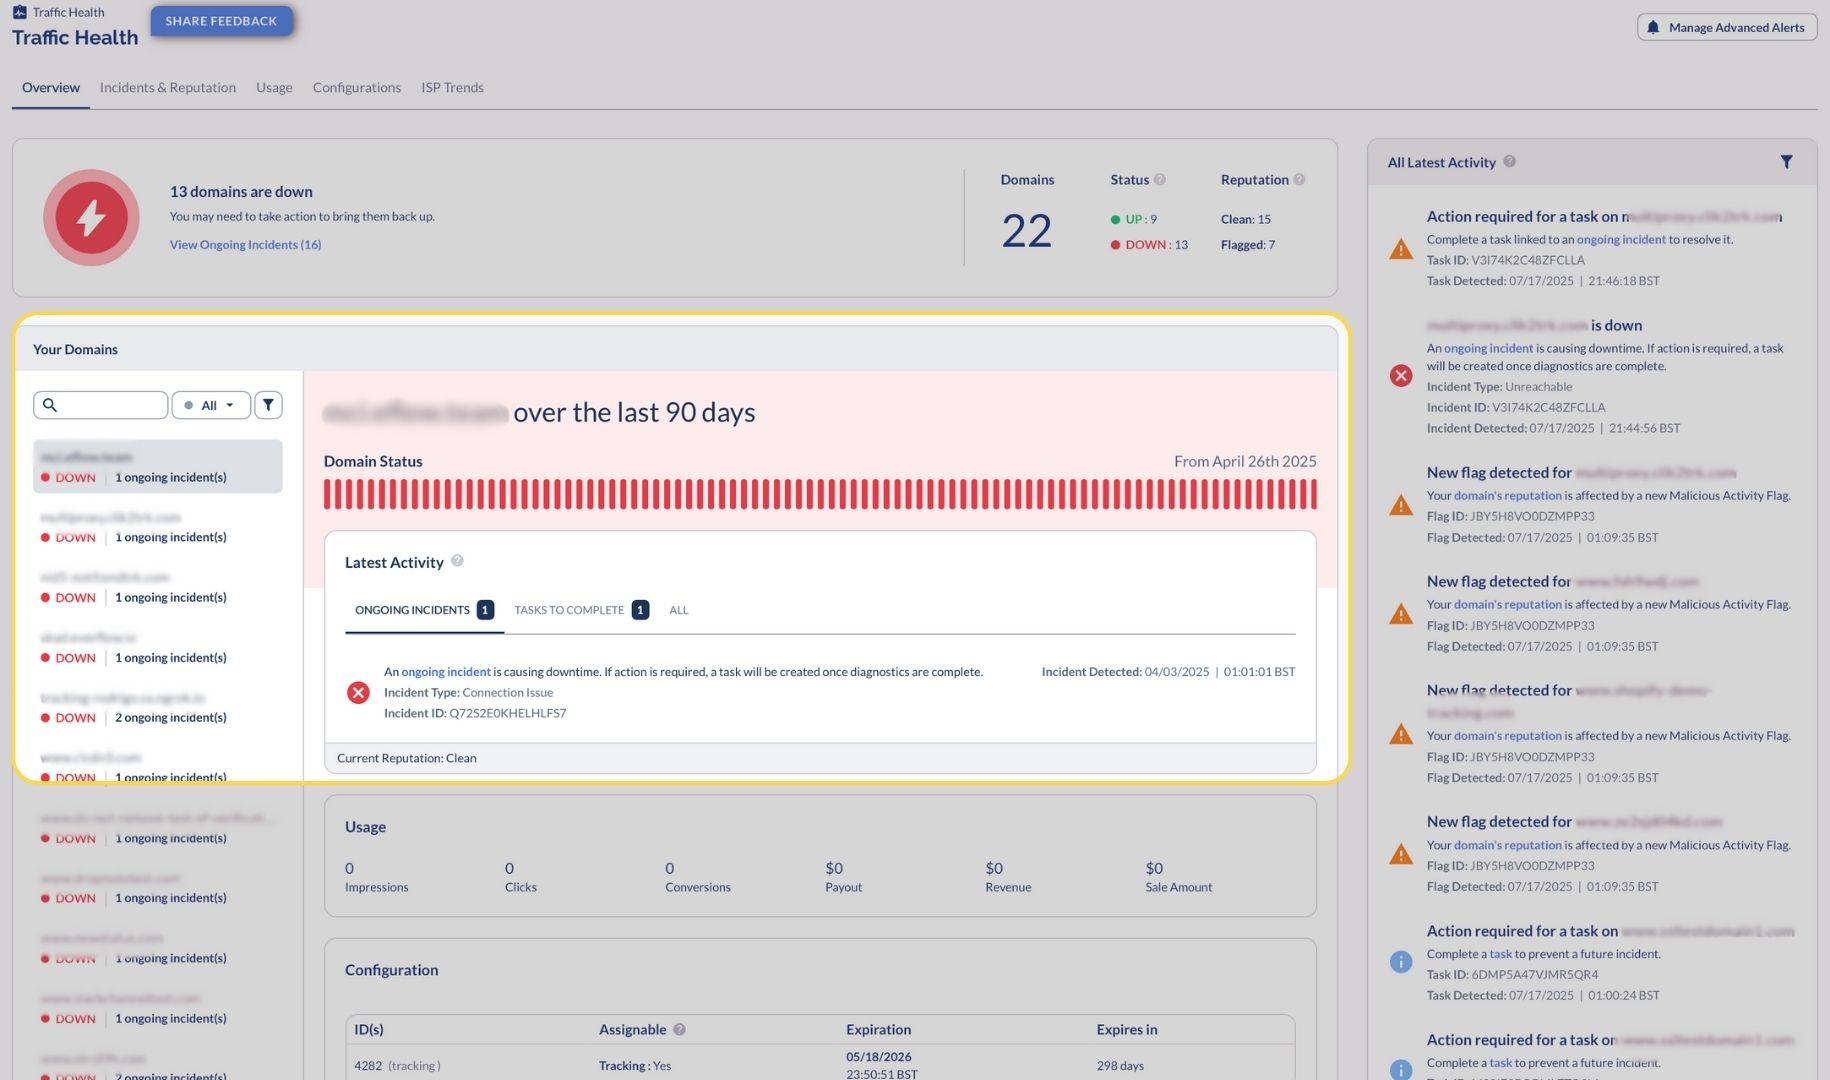
Domain List and Status
The left side of the dashboard displays all your domains with their current status:
- UP: Domain is functioning normally
- DOWN: Domain is experiencing downtime
- Numbers in parentheses indicate ongoing incidents that require attention
You can filter this list to focus on specific domains or status types using the search and filter options above the list.
Domain Status Timeline
For any selected domain, a visual timeline (one bar for each day) shows its health over the past 90 days:
- Green bars indicate normal operation
- Red bars show periods of downtime or issues
This historical view helps identify patterns or recurring problems that might need deeper investigation. The timeline gives you context around current issues and helps determine if a problem is new or part of an ongoing trend.
Latest Activity Section
The right side of the dashboard displays a chronological feed of domain-related activities:
- Recent status changes (incident detection and resolution)
- New incidents requiring attention
- Reputation flags detected (for Core and Premium plans)
- Tasks that require your action
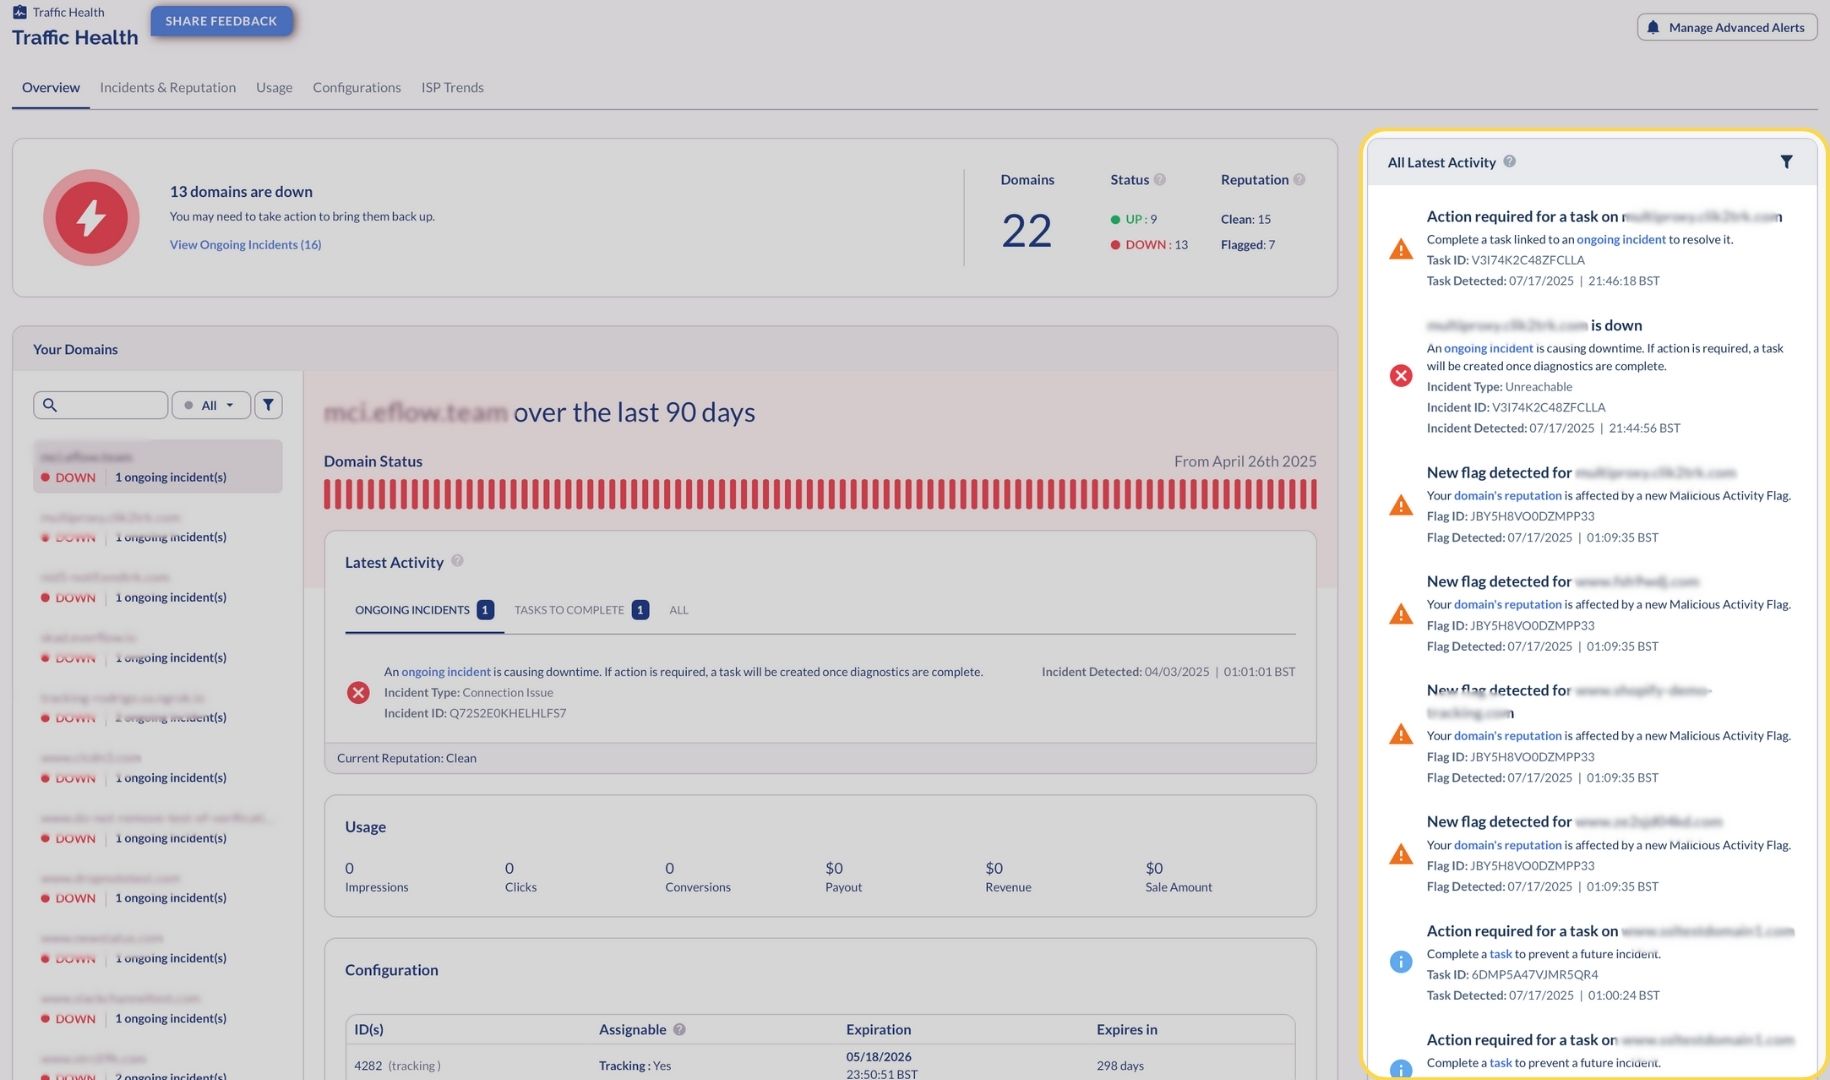
Activity Filter Options
You can filter the activity feed using the following options:
- Ongoing Incidents: Shows active domain issues that need attention
- Tasks To Complete: Displays pending tasks requiring your action
- Active Reputation Flags: Shows domains currently flagged by security providers
Detailed Popover Views
Clicking on activity items opens detailed popover windows with comprehensive information:
Incident Overview Popover
- Domain Affected and Incident ID
- Current status (Ongoing/Resolved)
- Incident Type (Unreachable, Connection Issue, Certificate Issue)
- Diagnosis Details with technical information
- Action Required indicator
- Associated Tasks with direct links
- Detection and observation timestamps
Reputation Overview Popover
- Domain name and reputation status
- Flag ID and current status
- Flag Detection Provider (Google Threat Intelligence, HetrixTools, EasyList)
- Blacklist Vendor information
- Detailed vendor descriptions
- Detection timestamp
Task Overview Popover
- Domain requiring attention
- Task ID and current status (Done, Pending, etc.)
- Detailed task description with actionable steps
- Direct link to view complete task details
This activity feed keeps you informed of all recent developments without having to navigate to different sections.
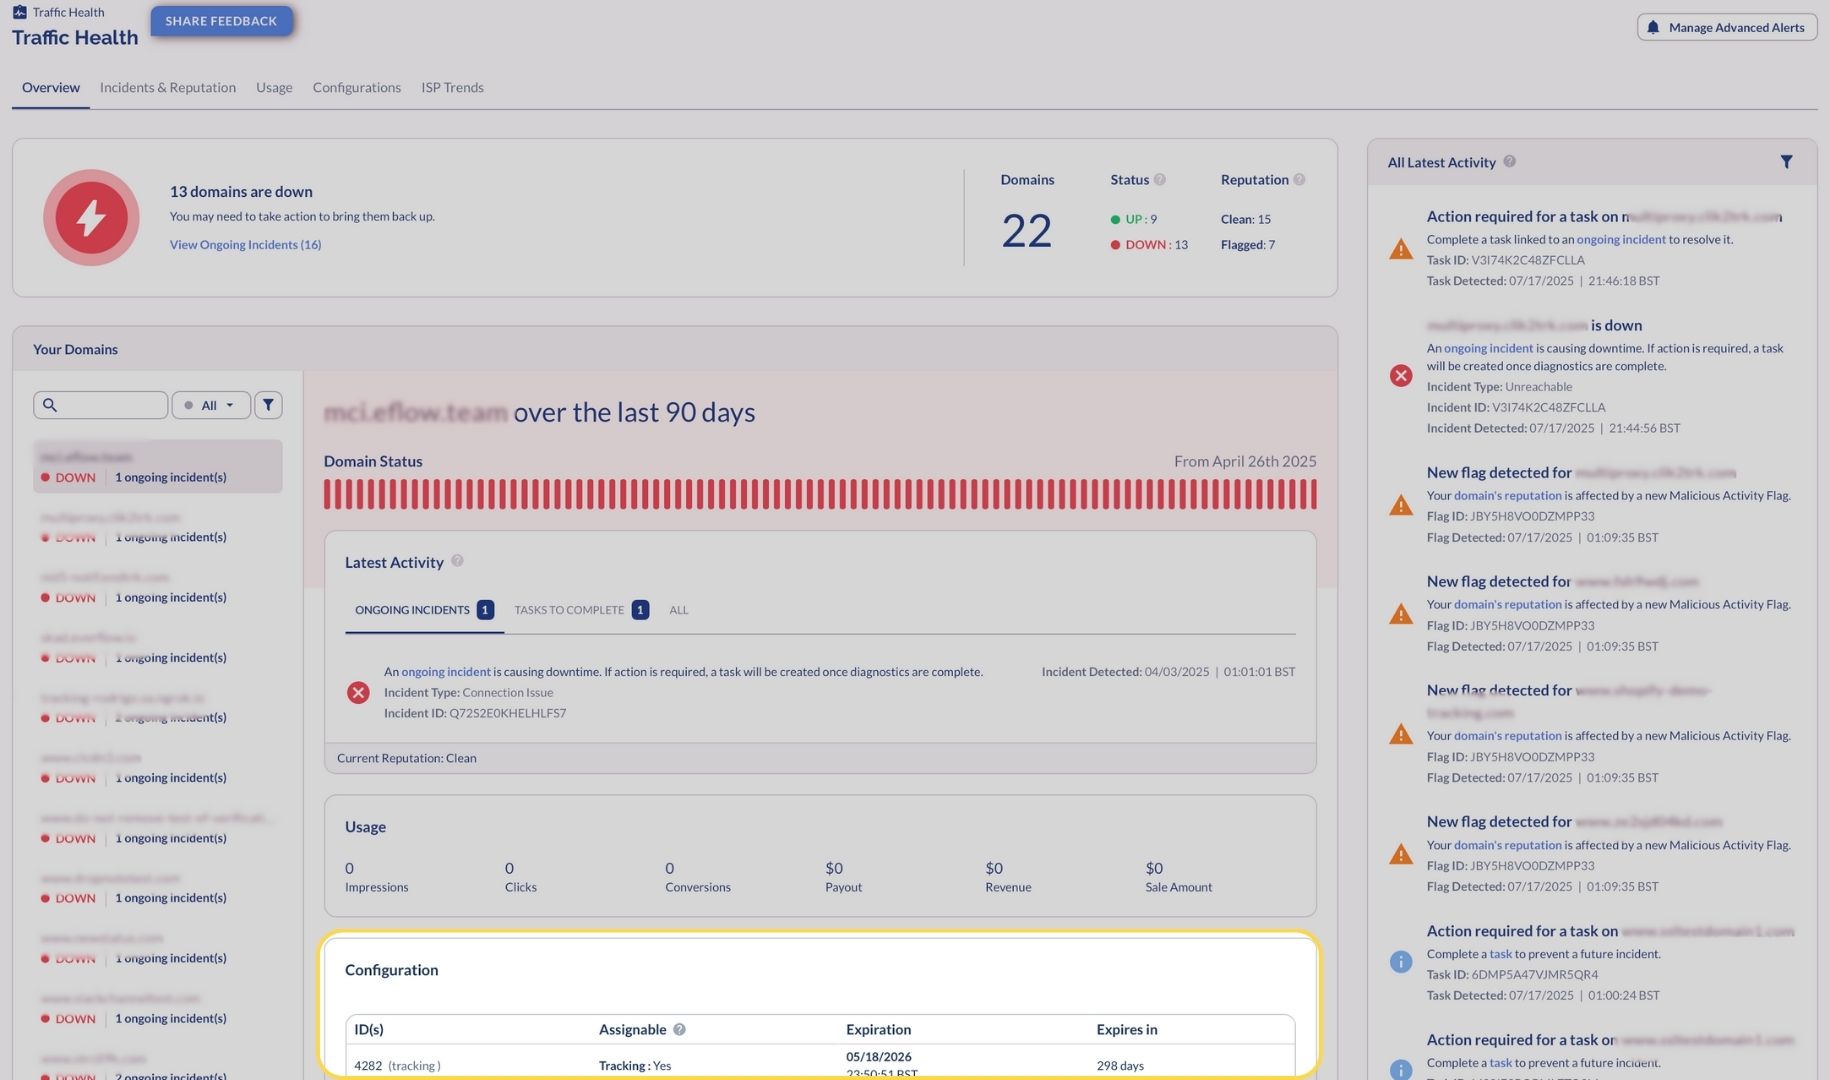
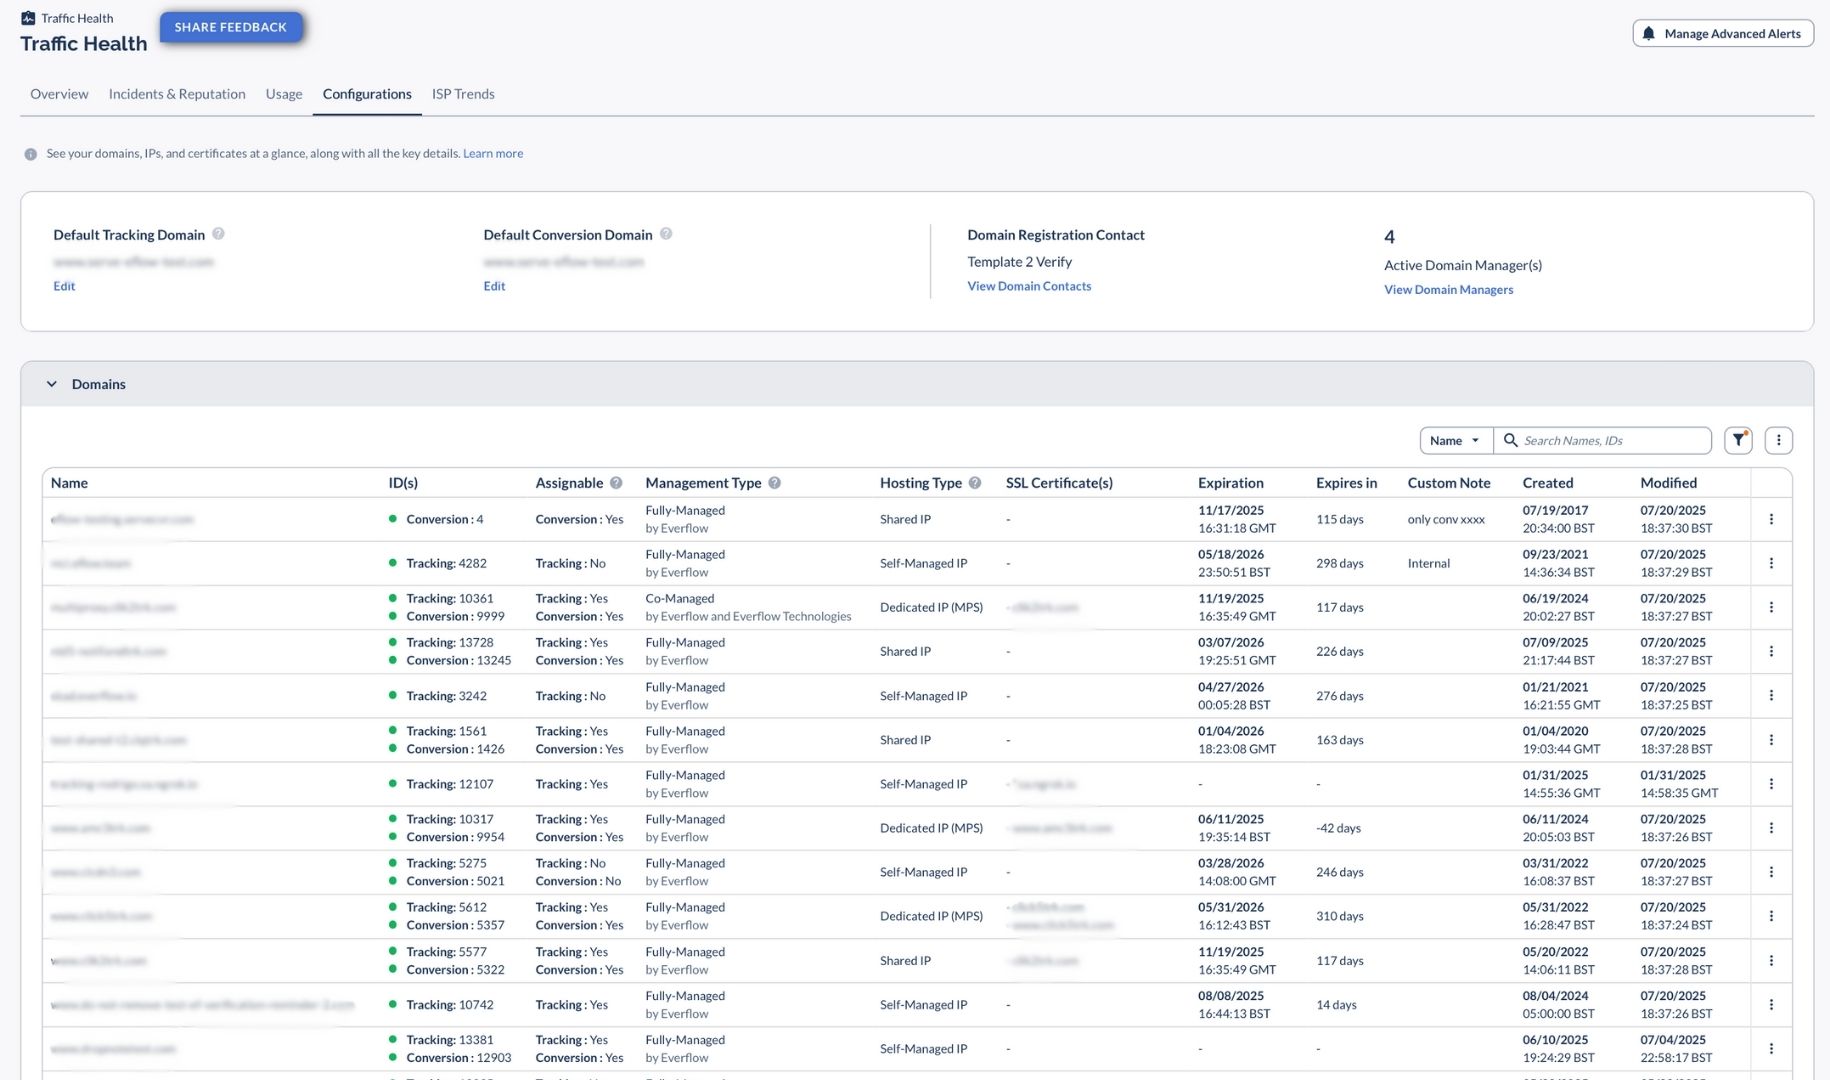
Configuration Section
At the bottom of the dashboard, the configuration panel provides detailed information about:
- Domain Tab: Basic domain configuration details
- SSL Certificates Tab: Certificate status and expiration dates
- Hosting Tab: IP assignments and server information
- Tracking IDs Field: Domain IDs used for tracking and conversion
Understanding Domain Types
Traffic Health categorizes domains based on their management type to help you understand monitoring coverage:
Fully Managed Domains
These are domains purchased by Everflow on your behalf and installed on Everflow infrastructure. They receive complete monitoring in all plans.
Co-Managed Domains
When you provide your own domain but it's installed on Everflow infrastructure, it's considered co-managed. These domains also receive full monitoring in all plans.
Self-Managed Domains
If you provide your own domain and host it on your own infrastructure (external proxy), it's classified as self-managed. Monitoring for these domains is only available in Core and Premium plans.
Bottom Line
The Traffic Health Overview tab provides a comprehensive, at-a-glance view of your domain health status. By centralizing critical information and providing real-time alerts, it helps you stay ahead of domain issues before they impact your business. Familiarize yourself with this dashboard to ensure you can quickly identify and address any domain problems that arise.


