Overview
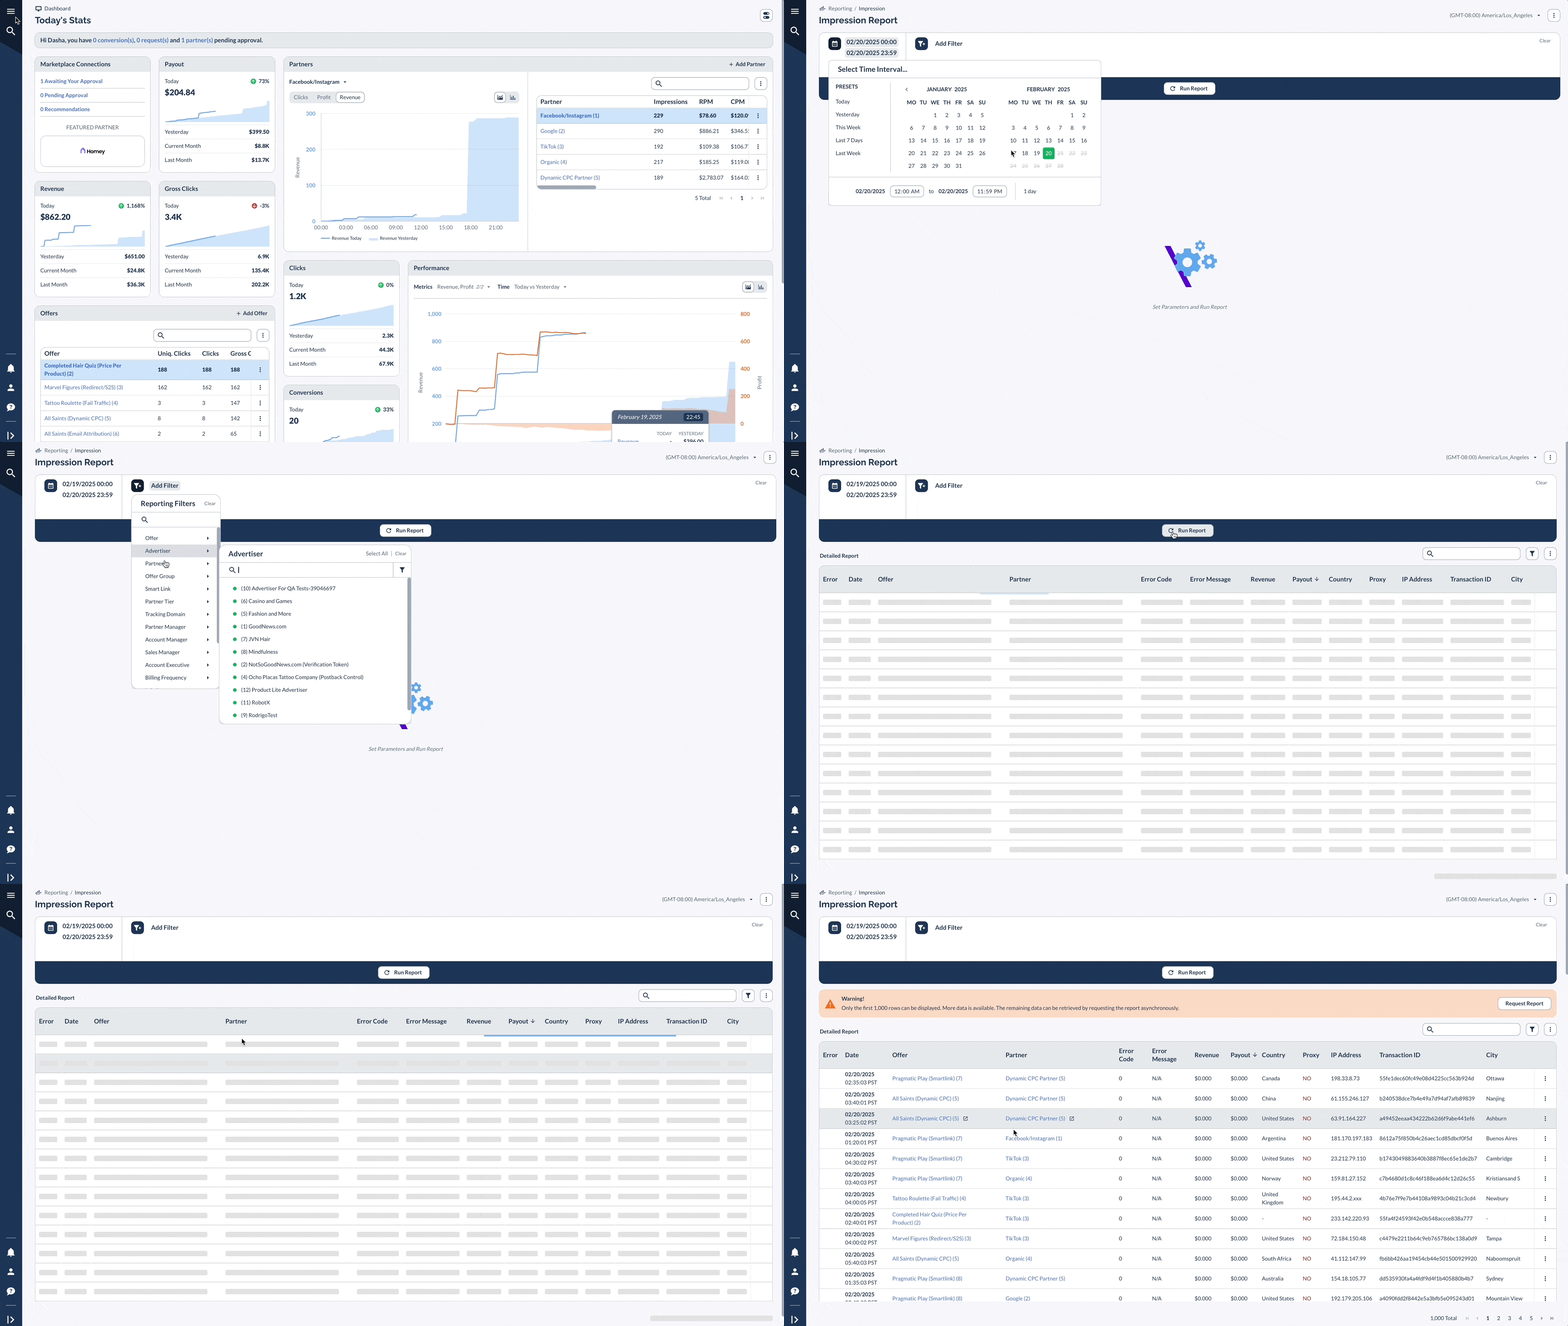
The Impression Report shows you how many times your ads were shown to users.
An impression happens whenever someone sees your ad - like when your banner shows up on a website or your video plays before a YouTube video, even if they don't click it.
This report helps you see how well your ads are reaching people and where they're being shown.
You can also use it to calculate how often people click your ads (Click-through rate = Clicks divided by impressions) and improve where you place them.
Key Features
How to Access and Use the Impression Report

Customizing Your Report
.gif)
Understanding the Data
Here are some key data points you might want to consider when looking at this report:
Advanced Features
.gif)
A Real-Life Example
Let's say you're running a digital advertising campaign for a new fitness app called "FitTrack Pro". Here's how you might use the Impression Report:
- Open last week's Impression Report.
- Apply a filter for the "FitTrack Pro" offer.
- In the report, you notice:
- Most impressions are coming from the United States, but there's a significant number from Canada as well.
- Using the "Converted" column, you see Partner A has a high number of impressions but very few of them led to conversions. Meanwhile, Partner B has fewer impressions but a higher conversion rate, suggesting your payout structure with Partner A might need adjustment since you're paying for many non-converting impressions.
- There's a spike in impressions with a specific Sub1 value, and the "Converted" column shows these impressions have an above-average conversion rate.
- Diving deeper, you observe:
- A small percentage of impressions are coming from proxy IPs, which might indicate potential ad fraud.
- Based on this analysis, you might decide to:
- Expand your campaign in the Canadian market, given its unexpected performance.
- Renegotiate payout rates with Partner A since they're delivering quantity but not quality, while considering a bonus structure for Partner B whose traffic converts better.
- Scale up the ad placement associated with the high-performing Sub1 value since these impressions are proving valuable.
- Implement stricter controls to reduce impressions from proxy IPs.
- To track these changes, you set up a scheduled weekly Impression Report focused on these key metrics.
By regularly using the Impression Report this way, you can optimize your payout structures based on actual conversion data, ensure you're not overpaying for non-converting impressions, and maintain profitable relationships with partners who deliver quality traffic.
Best Practices
Keep an eye on how your Impressions compare to your Conversions to understand which views are actually leading to sales.
You can make your targeting better by looking at where your traffic is coming from geographically, while watching for proxy usage helps keep your traffic quality high.
By analyzing how different Sub IDs perform, you can figure out which traffic sources and ad placements are working best for you.


