Overview
The Flex Report gives you complete control over how you slice and dice your data. Think of it as building your own custom report from scratch - you pick exactly which columns you want to see and how you want to group everything together.
Here's what makes it powerful: while most reports limit you to one or two ways of looking at your data, the Flex Report lets you combine up to 10 different dimensions. Want to see performance by offer, partner, country, tracking domain, and the specific ADV values you're passing? No problem. Each row becomes a unique combination of all those elements, so you can spot patterns you'd never see otherwise.
It's especially useful when you're passing custom information through parameters like ADV1, ADV2, etc. Maybe you're running loan campaigns and passing debt amounts, or you're tracking user demographics like age ranges. The Flex Report lets you analyze all that custom data alongside your standard metrics.
Why Use It?
- Complete Flexibility: Build reports that show exactly what you need to see
- Deep Analysis: Group and break down data in multiple ways
- Focus on What Matters: Use filters to look at specific parts of your data
- Find Opportunities: Spot trends and patterns in your data
- Better Decisions: Get clear insights to improve your marketing
Accessing The Report
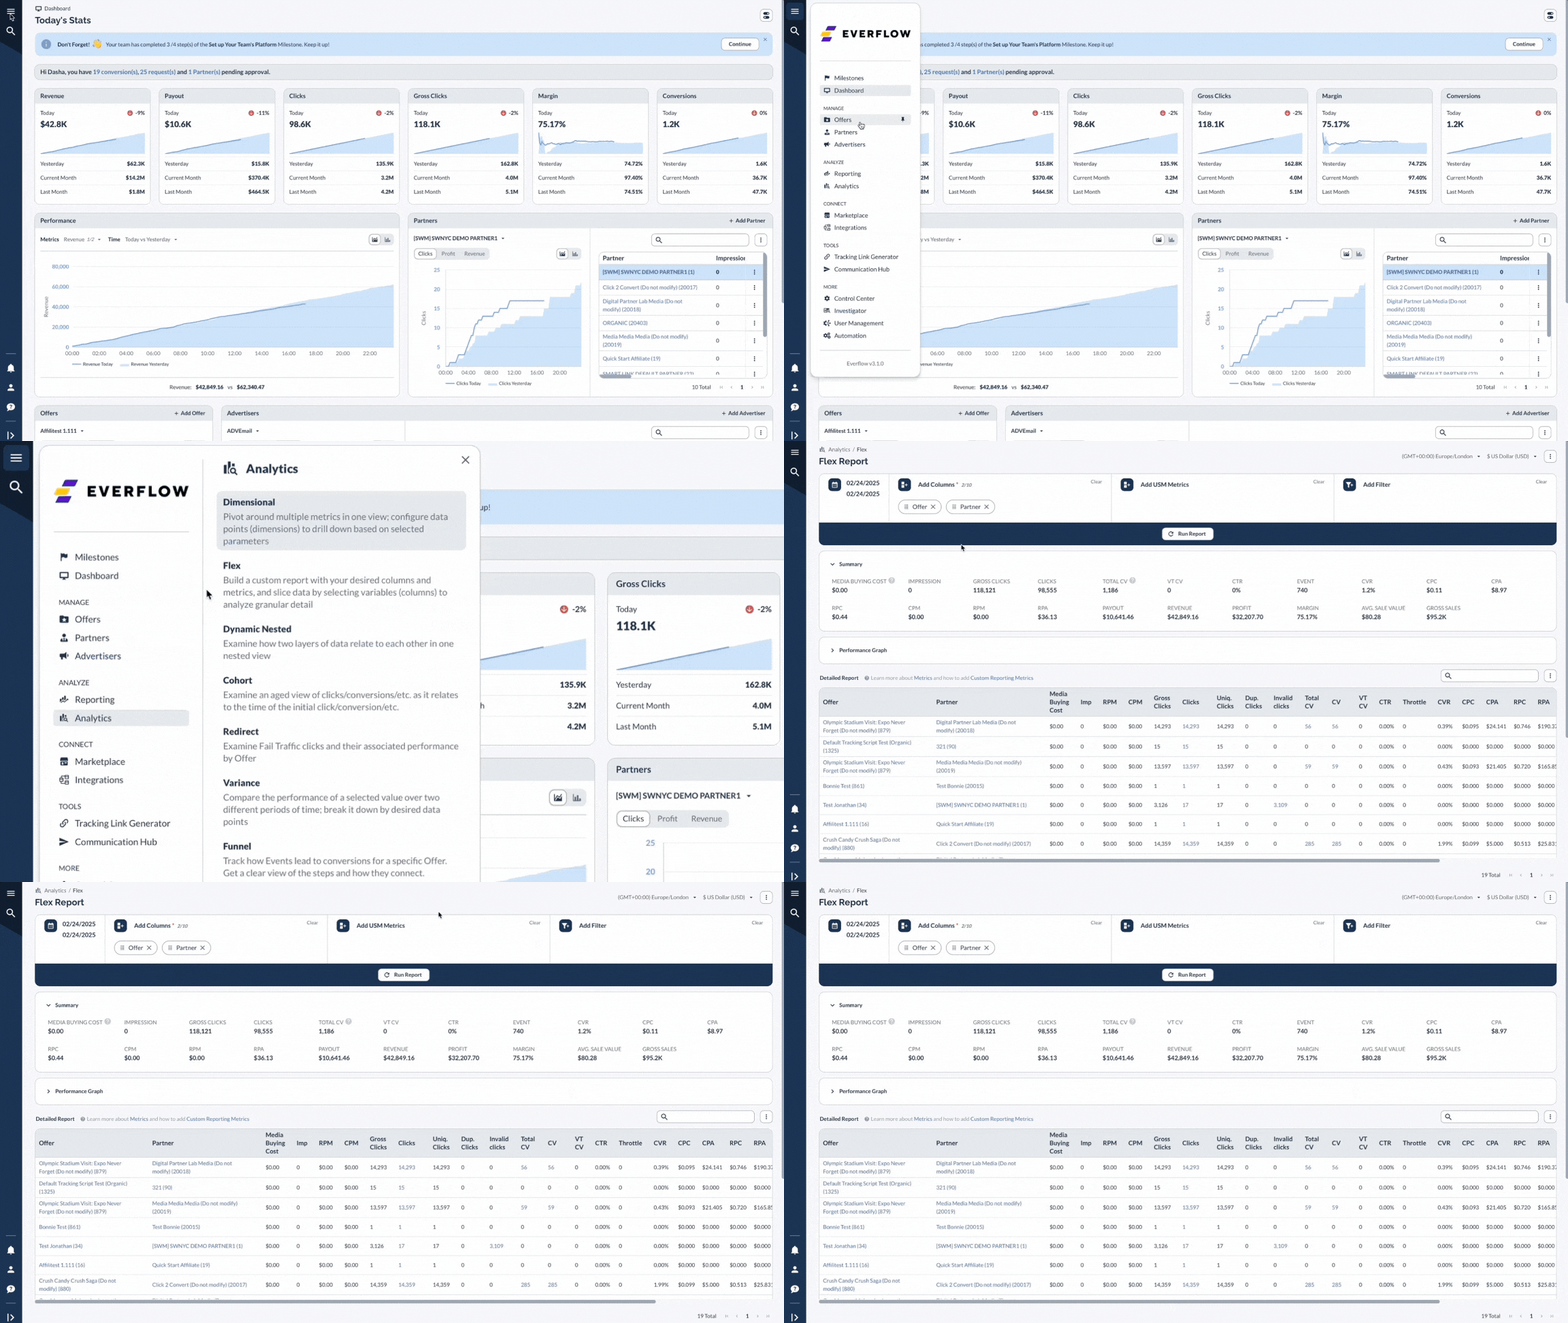
Find and open the Flex Report in Everflow.

Setting Up Your Report
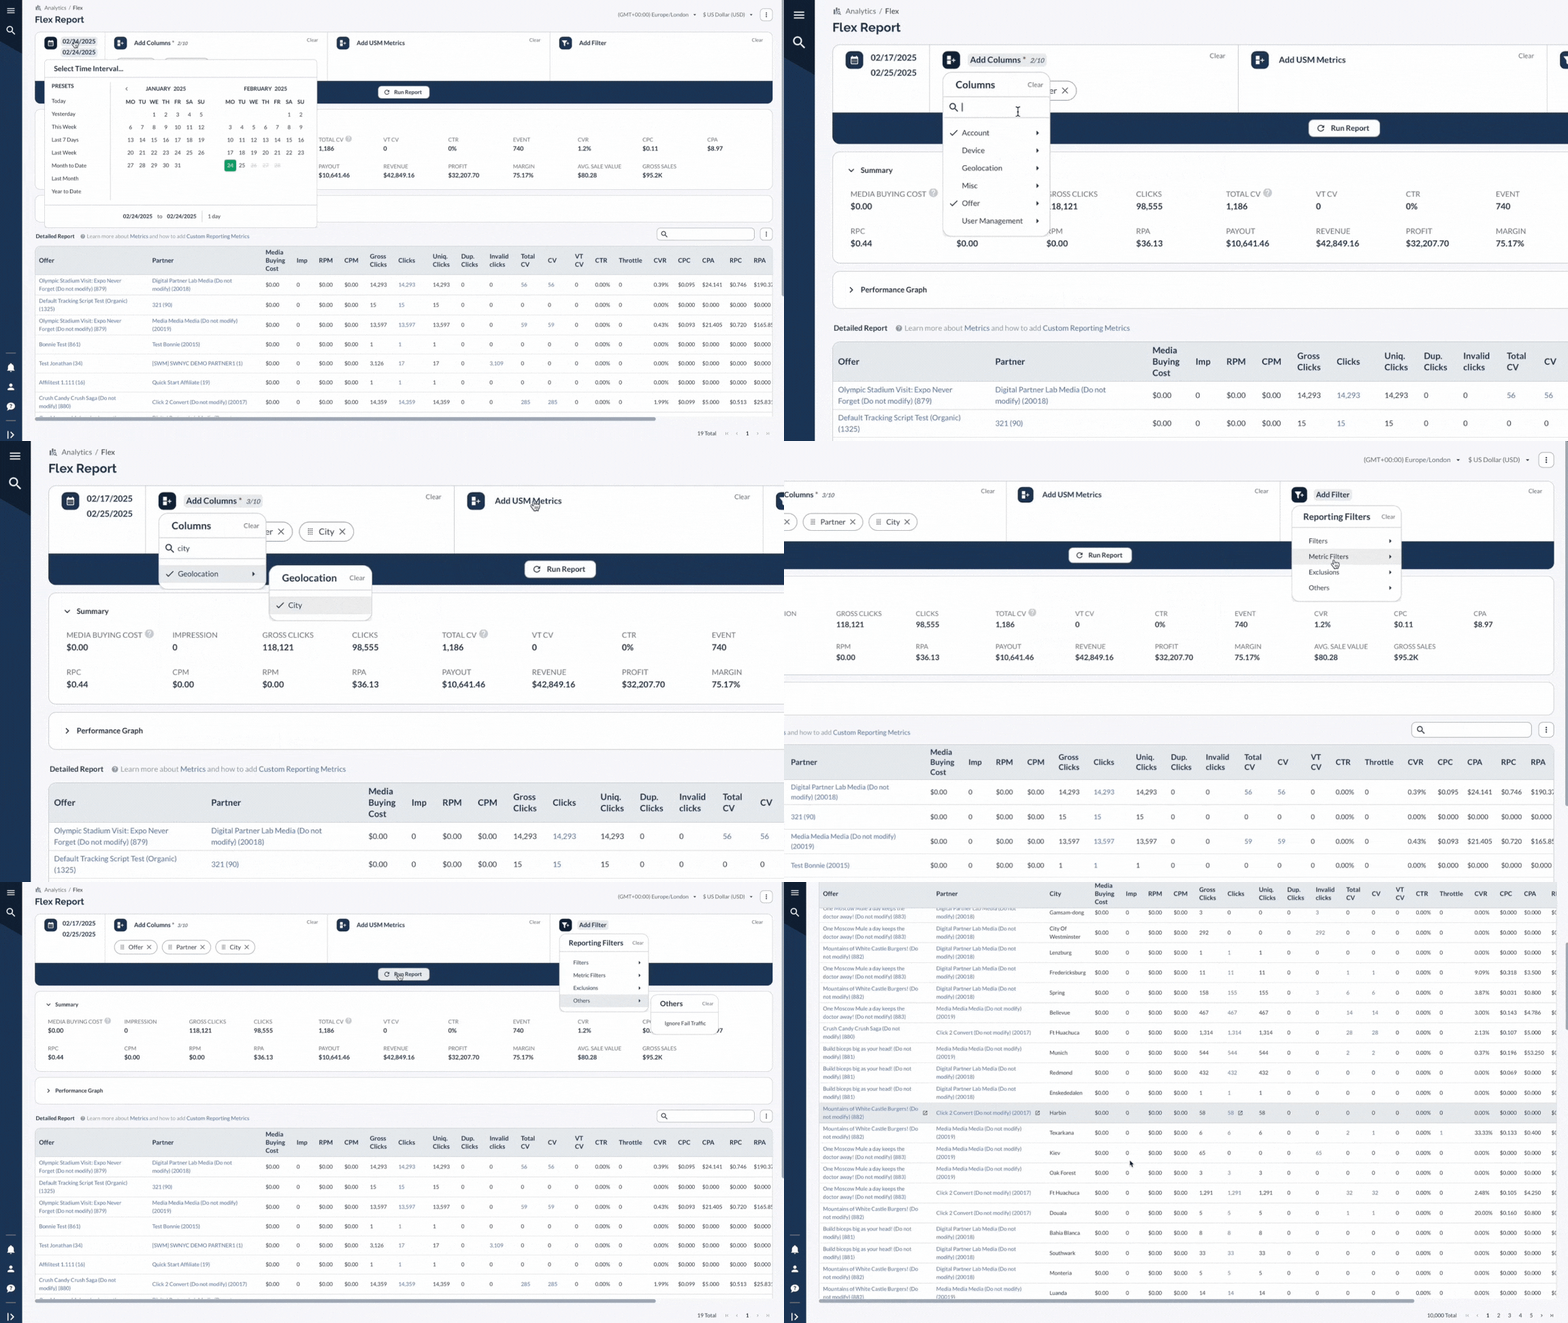
Configure the columns and filters for your Flex Report.

Interpreting The Results
Understand and analyze the data presented in the Flex Report.
.gif)
A Real-Life Example
Let's say you're running campaigns and want to understand exactly where your best traffic is coming from. You suspect there are patterns you're missing, but standard reports aren't giving you the full picture.
The Flex Report basically turns into your detective tool for finding those hidden golden combinations that make all the difference in your campaigns.
Advanced Features
Bottom Line
The Flex Report is like a super-powered pivot table that lets you add up to 10 different data points to analyze your performance. It's perfect when you need to get really specific with your data - like seeing how each offer performs by partner, country, and tracking domain all in one view.


