

Overview
Everflow gives you access to several reports that show different angles of your performance — clicks, conversions, revenue, and more. The trick is knowing which report to open for which question.
This guide breaks down the main reports available to you and when to use each one.
Which Report Should I Use?
Start with the question you're trying to answer:
"How much did I earn?"
Offer Report → Payout column
"Is my traffic actually tracking?"
Click Report → Look for your clicks
"Why didn't my conversion count?"
Conversion Report → Check status column
"Which offers perform best?"
Offer Report → Sort by CVR or EPC
Your Main Reports
Here's what each report shows and when to use it.
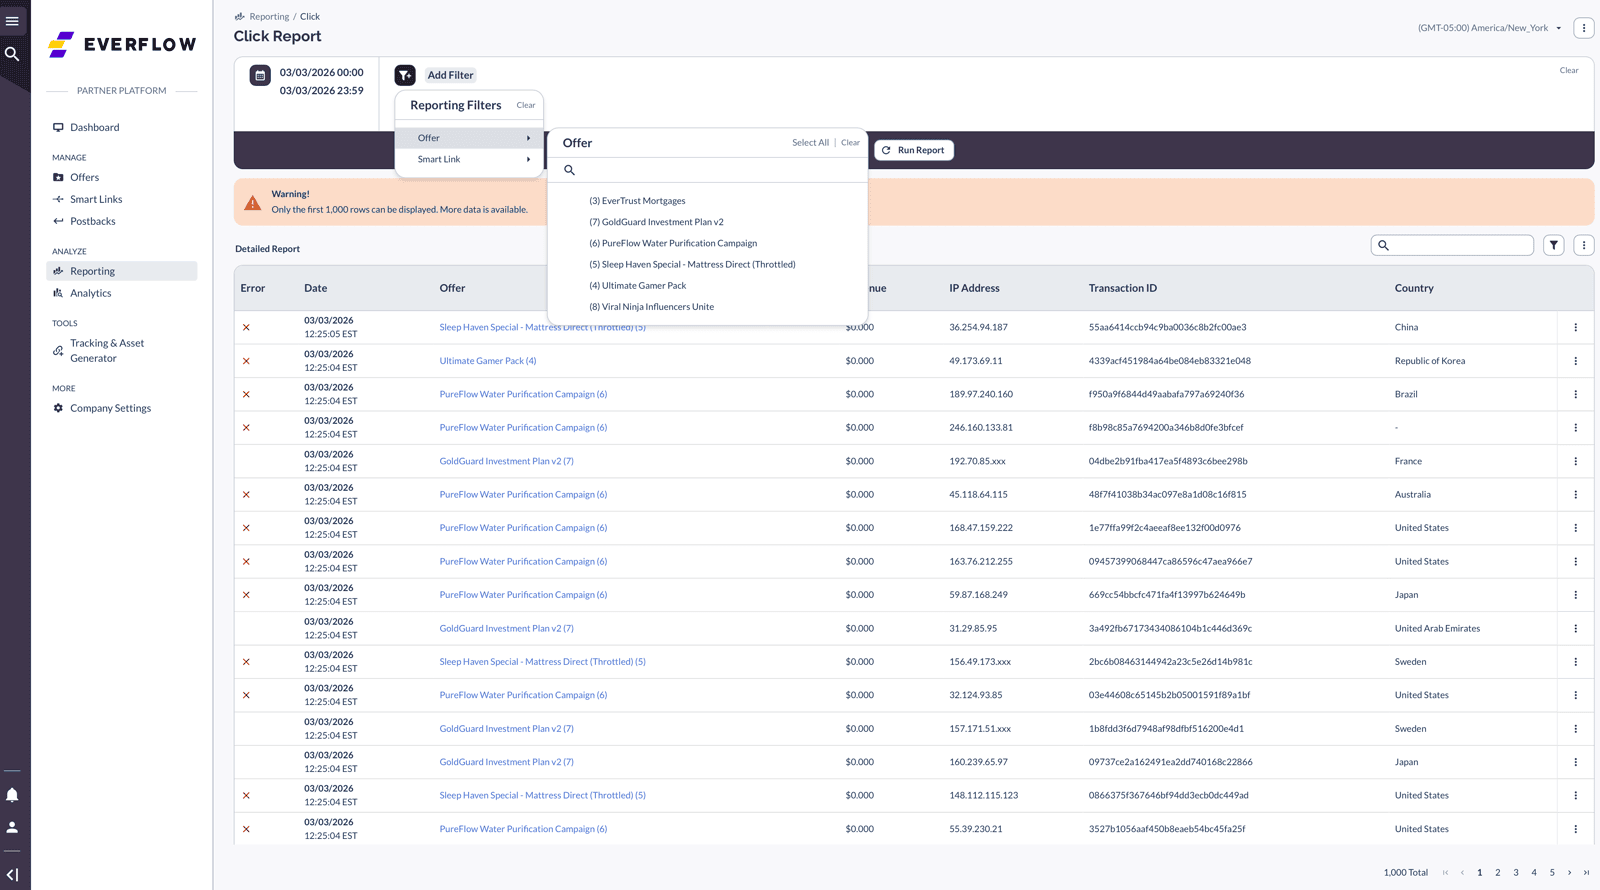
Click Report — Shows every click your tracking links receive. Use it to verify your traffic is being recorded, check click volume by day, and identify where your clicks are coming from (country, device, OS). This is your first stop when troubleshooting.
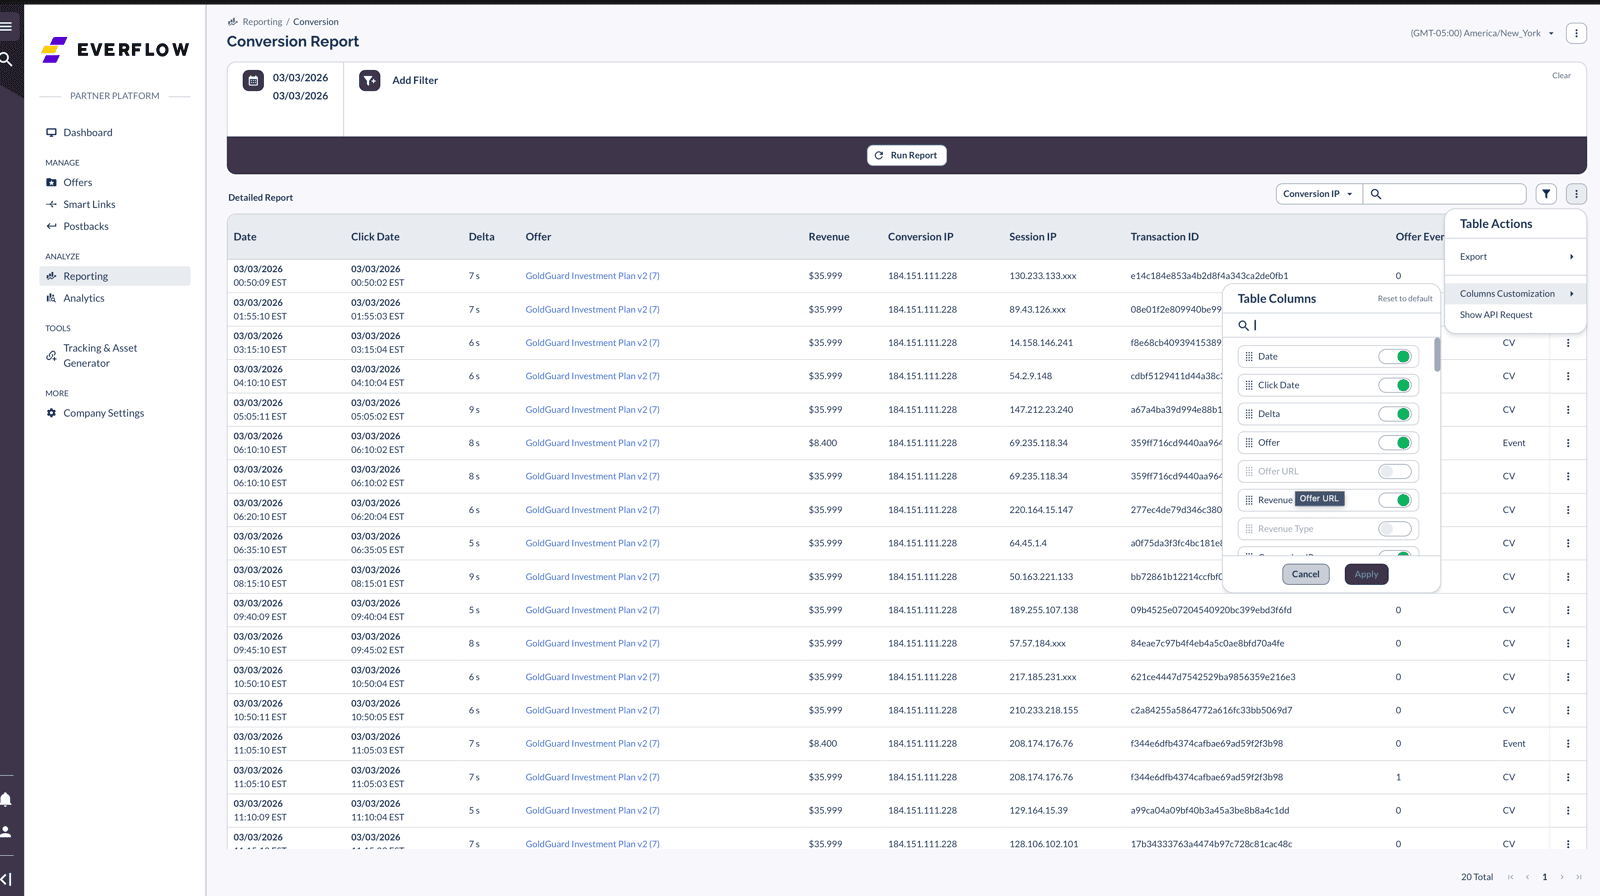
Conversion Report — Shows individual conversion events with their status (Approved, On Hold, Rejected). Use it to troubleshoot missing conversions, check conversion quality, and see the time between click and conversion (delta).
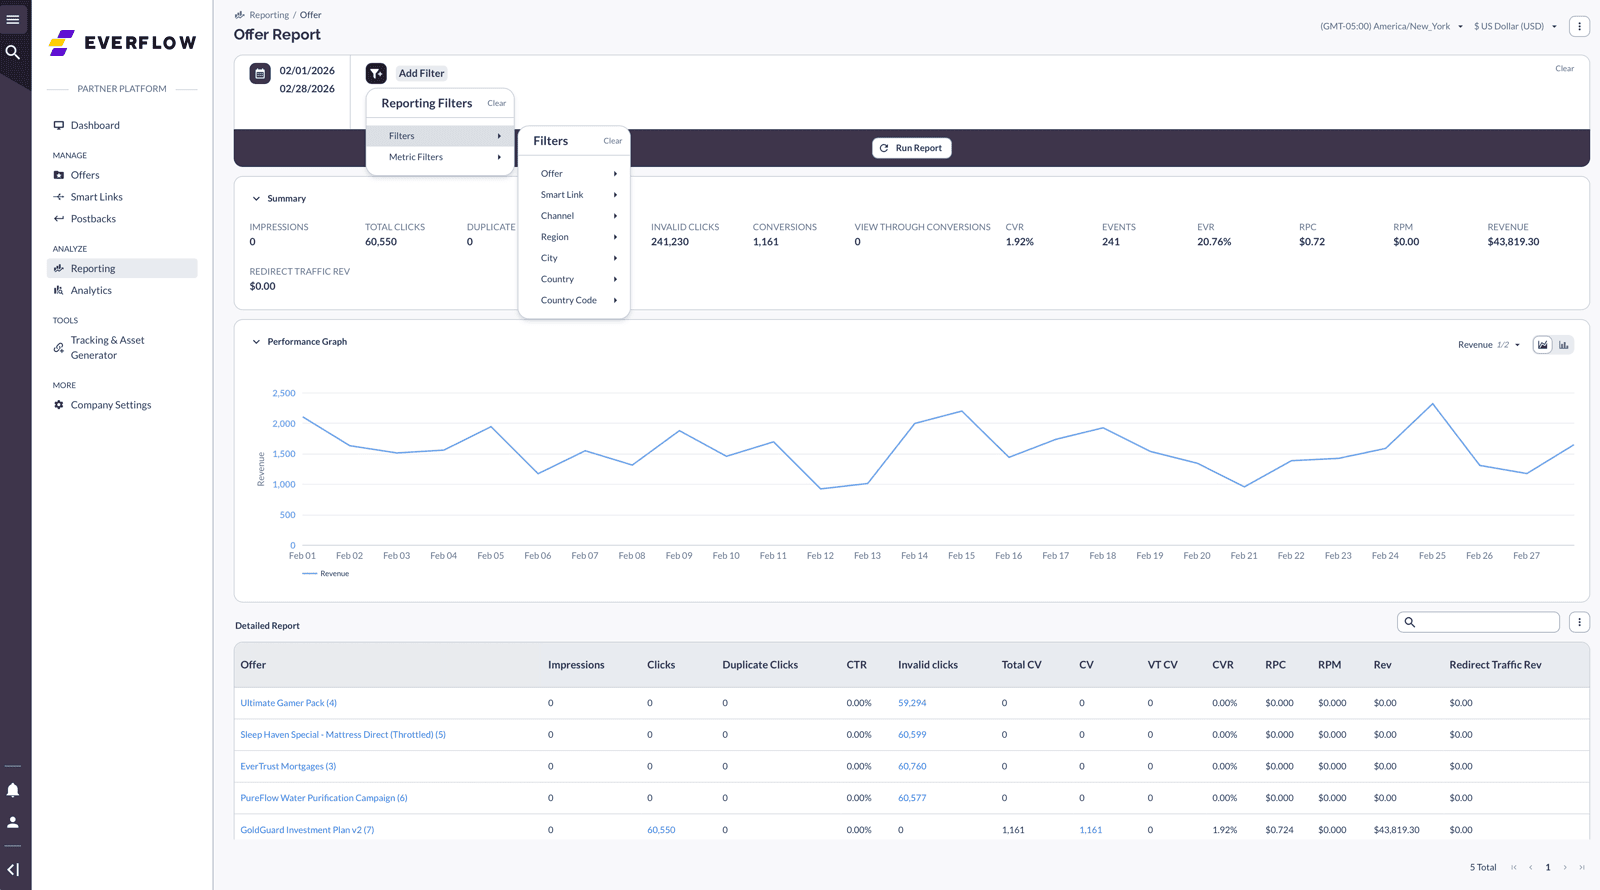
Offer Report — Gives you a summary view per offer — total clicks, conversions, payout, CVR, and EPC. This is your daily dashboard for checking overall campaign health.
Event Report — If the advertiser tracks multiple actions (signup, purchase, subscription), each one shows up as a separate event. Use this report to see which events are firing and their individual payouts.
Key Metrics Explained
Here are the metrics you'll see across your reports and what they mean:
- Gross Clicks — The raw total of all clicks, including duplicates and bots. This is the unfiltered number.
- Unique Clicks — Deduplicated clicks — one per user. This is the more accurate measure of real traffic.
- CVR (Conversion Rate) — The percentage of clicks that result in a conversion. Formula: Conversions / Gross Clicks. Higher is better.
- EPC (Earnings Per Click) — How much you earn per click on average. Formula: Total Payout / Total Clicks. This is your key efficiency metric.
- Payout — The amount you earn per conversion. This is what matters to your bottom line.
- Delta — The time between when a user clicks and when they convert. Useful for understanding user behavior and spotting anomalies.
Revenue vs. Payout
You may see both "Revenue" and "Payout" referenced in Everflow. Here's the difference:
- Revenue — What the advertiser pays the network for each conversion. This is only visible to network operators, not to you.
- Payout — What you receive for each conversion. This is the number that shows up in your reports.
As a partner, you'll only see Payout data in your reports. Revenue is visible only to network operators. If you see a "Revenue" column, it will show $0.00 or be hidden entirely.
Timezone Matters
All reports in Everflow are based on the network's timezone, not yours. If you're in a different timezone than the network operator, your daily totals may not line up with what you expect.
For example, if the network runs on EST and you're on PST, a conversion at 11pm your time shows up as the next day in Everflow.
Timezone mismatches are the #1 cause of reporting discrepancies between partners and networks. If your daily totals don't match what you expect, ask your account manager to confirm the network's timezone setting.
Tips for Getting the Most from Reports
- Use date range filters to narrow down to the period you care about.
- Group by Sub ID to see which placements, creatives, or traffic sources perform best.
- Export to CSV for deeper analysis in a spreadsheet.
- Check your reports daily during the first week of a new campaign to catch issues early.
- Compare day-over-day trends rather than looking at a single day in isolation.
Related Articles
- How Partner Payments Work — Understand the full journey from conversion to cash.
- Offer Report For Partners — Deep dive into your most-used report.
- Essential Reports For New Partners — A broader overview of all reporting tools available to you.

